
It depends on what type of system/network you’re running. In 90% of networks, or networked systems, this is a grand-scale disaster. Alerts are popping up everywhere, engineers go far beyond “day-time work” to get things back to normal, customers are panicking and potentially leaving the platform and the customer care lines are on fire. Half of the network is a large fraction, but I would bet that the same would happen even when 10% or 20% of the network experiences an outage.
It’s not like that when you run your services on a decentralized, distributed P2P network, such as IPFS! At the beginning of 2023, a critical component of the IPFS network, namely the public IPFS DHT, experienced a large-scale incident. During this incident, 60% of the IPFS DHT Server nodes became unresponsive (opens new window). Interestingly, no content became unreachable and almost nothing in the network looked like the majority of the network was basically down. We did observe a significant increase in the content routing/resolution latency (in the order of 25% initially), but this in no way reflected the scale of the event.
In this blog post, we’ll go through the timeline of the event from “Detection” to “Root Cause Analysis” and give details about the engineering team’s response. A summarizing talk on the content of this blog post was given at IPFS Thing 2023 (opens new window) and can be found on YouTube (opens new window).
# ❗️Detection: we've got a problem!
At the beginning of 2023, a critical component of the IPFS network, namely the public IPFS DHT, experienced a large-scale malfunction. During this situation, 60% of the IPFS DHT Server nodes became unresponsive (opens new window).
Unresponsive here means that nodes would seem to be online, they would accept connections from other nodes, but they wouldn’t reply to requests. Basically, when a node would try to write to one of the unresponsive nodes, the unresponsive node would terminate the connection immediately.
Given that these nodes seemed to be functional, they occupied several places in other nodes’ routing tables, when in fact they shouldn’t have.
The problem came down to a misconfiguration of the go-libp2p resource manager - a new feature that shipped with kubo-v0.17. The problematic configuration which was applied manually (i.e. was not based on the default values of kubo-v0.17) was set to such values that any attempt to interact with the nodes would be flagged as a resource exhaustion event and would trigger the corresponding “defense” mechanism. In practice, this materialized as a connection tear-down. It is worth noting that kubo is the most prevalent IPFS implementation using the public IPFS DHT with ~80% of nodes in the DHT being kubo nodes (see most recent stats (opens new window)).
Content was still findable through kubo, so no alarms were raised. However, some of our research teams observed unusual error messages:
> Application error 0x0 (remote): conn-22188077: system: cannot reserve inbound
connection: resource limit exceeded
Since PUT and GET operations were completing successfully, the error didn’t seem like one that would trigger widespread panic. We were seeing slower performance than normal and had been investigating whether recent changes with Hydra boosters (opens new window) had bigger impacts than we were expecting. It was at this time that we had a physical meeting of our engineering teams and one of the items on the agenda was to figure out where this error was coming from.
# ❓ Diagnosis: what was happening?
We quickly realized that there was a resource manager issue where the remote node was hitting a limit and closing the connection (opens new window). After looking into the details of the resource manager and the error itself (i.e., cannot reserve **in**bound connection), we realized that the root cause of the issue was related to the remote node. It turned out that the resource manager was manually misconfigured by a very large percentage of nodes to values that were not in the default configuration by the “vanilla” version of the resource manager that shipped with kubo-v0.17.
As mentioned earlier, the GET and PUT operations were completing successfully, so our next step was to identify the scale of the problem. Our main goals were to figure out:
- what percentage of nodes in the network were affected
- if there was a performance penalty in either the PUT or the GET operation, or both
Through a combination of crawling the network and attempting connections to all ~50k DHT Server nodes (i.e., those that store and serve provider records and content), we found that close to 60% of the network had been affected by the misconfiguration. Clearly this was a very large percentage of the network, which made it urgent to look into the performance impact. We followed the below methodology:
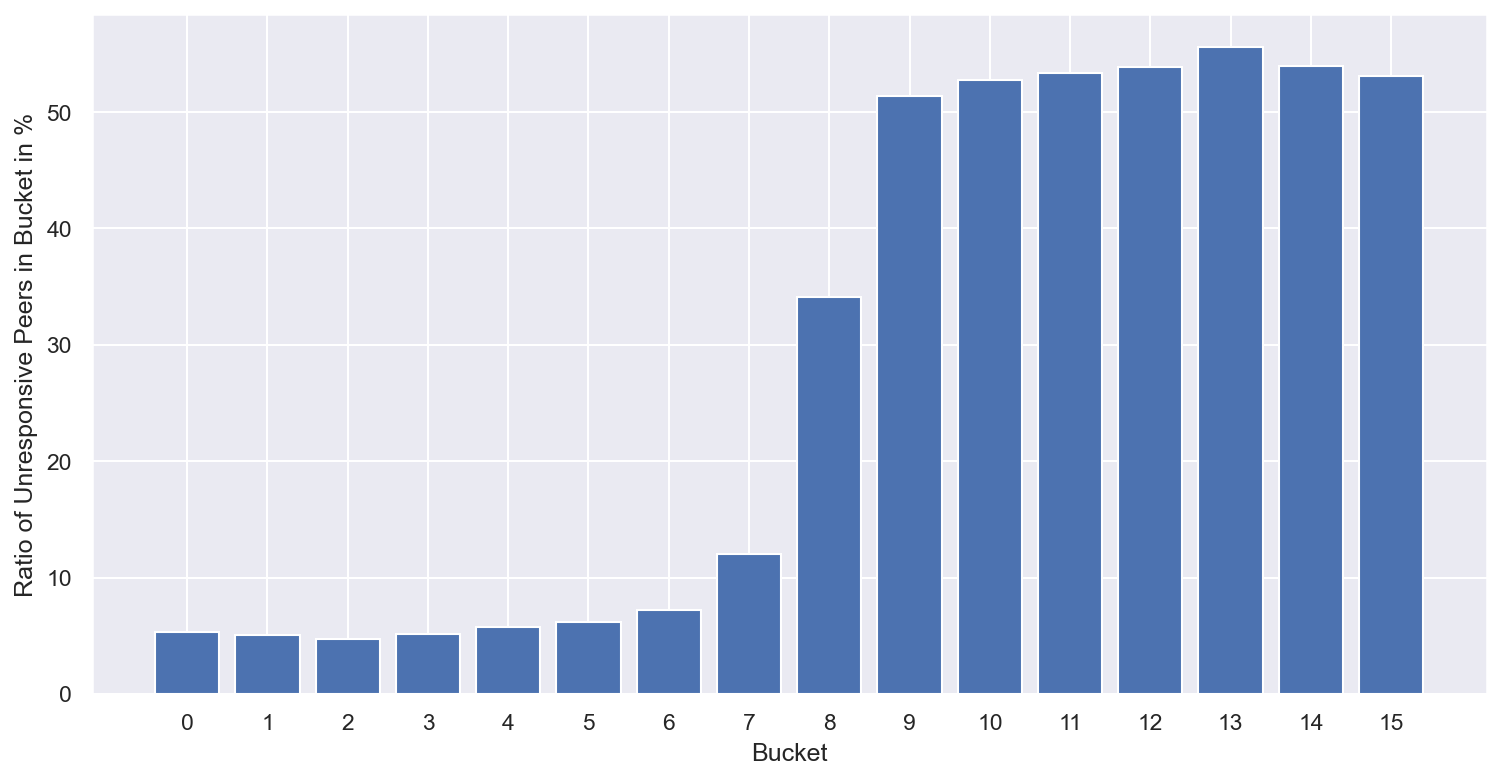
We wanted to figure out which buckets in the nodes’ routing tables did the affected nodes occupy. We found that they occupied the higher buckets of the nodes’ routing tables, which meant that most likely PUTs would get slower, but GETs should not be affected too much. This is because the DHT lookup from the GET operation terminates when it hits one of the 20 closest peers to the target key, while the PUT operation terminates when it has found all the 20 closest peers. Since a significant portion of the network was unresponsive, the PUT operation hit at least one unresponsive node, but the GET operation had good chances of finding at least one responsive node within the 20 closest.
After further investigation and given the very large percentage of nodes that were affected by the resource manager misconfiguration, we started looking into the impact of the incident to the GET performance.
A GET request that hits one of the affected, unresponsive nodes would get the connection shut down by the remote, but would get stuck there until it timed out, at which point it would re-issue the request to another peer. The relatively high concurrency factor of the IPFS DHT (
alpha = 10) helps in this case, as it means that for any given request up to 10 concurrent requests can be in flight. This helps a lot even with a high percentage of unresponsive nodes as it means that at least one of the 10 peers contacted will respond.
This is because the DHT lookup from the GET operation terminates when it hits one of the 20 closest peers to the target key, when the PUT operation terminates when it has found all the 20 closest peers.
In the meantime, we estimated that a non negligible number of GET requests were hitting at least one unresponsive node during the lookup process. This event results in a timeout and significantly increases the request latency. There is a high probability that an unresponsive node is encountered during the last hops of the DHT walk because unresponsive peers are mostly present in higher buckets as the above figure shows.
To quantify the impact, we crawled the network and gathered the PeerIDs of unresponsive nodes. We set up six kubo nodes in several locations around the globe and attempted to: i) publish content (PUT), and, ii) retrieve content (GET) for two cases: 1) when interacting with all nodes in the network, and, 2) when ignoring all responses from the unresponsive peers, whose PeerIDs we knew and were cross-checking with in real time.
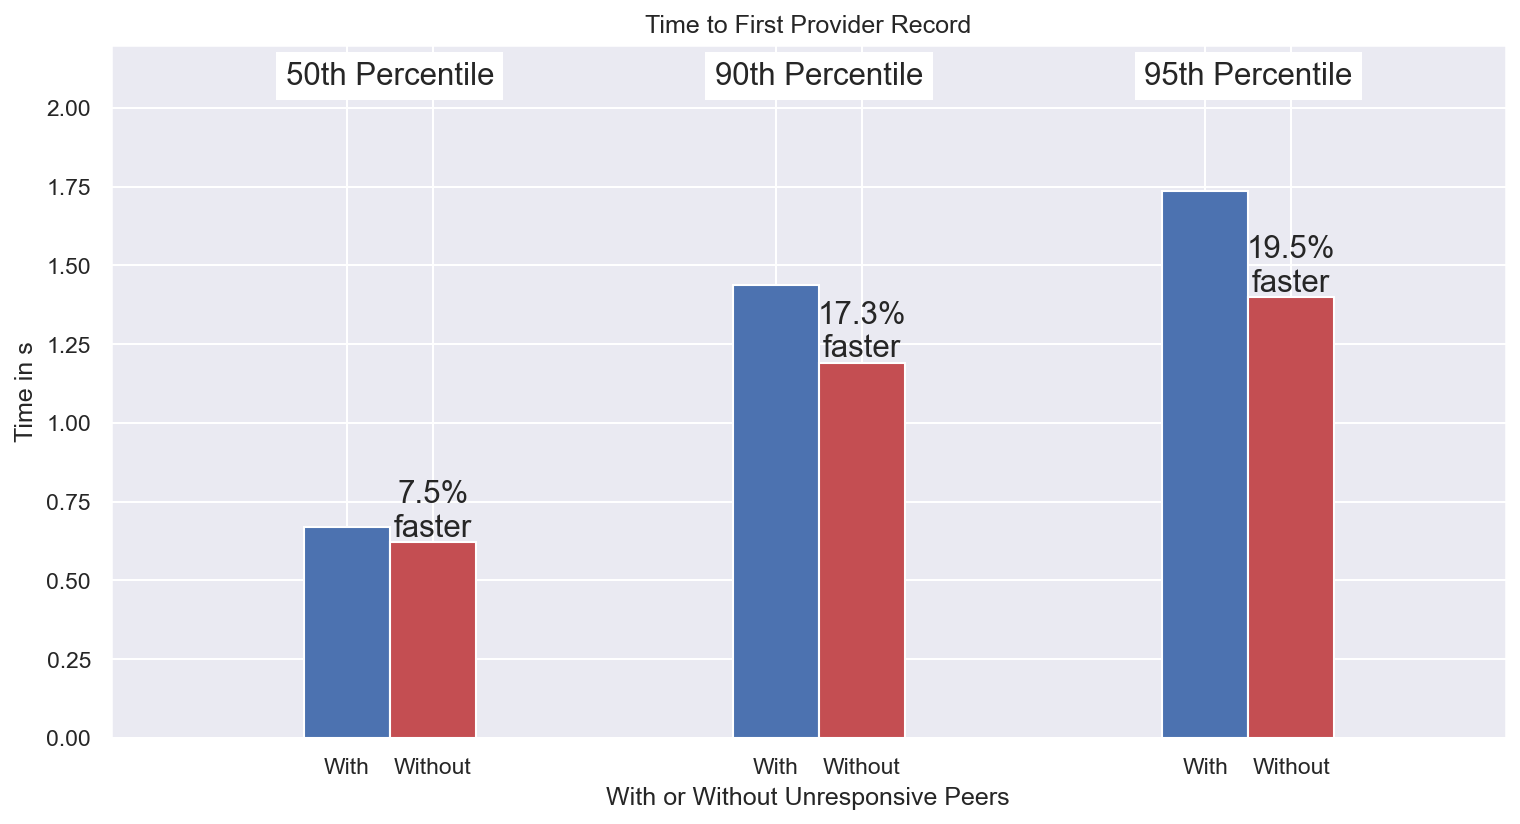
- The results we found were as follows:
- The PUT operation was slowed down by approximately 10%
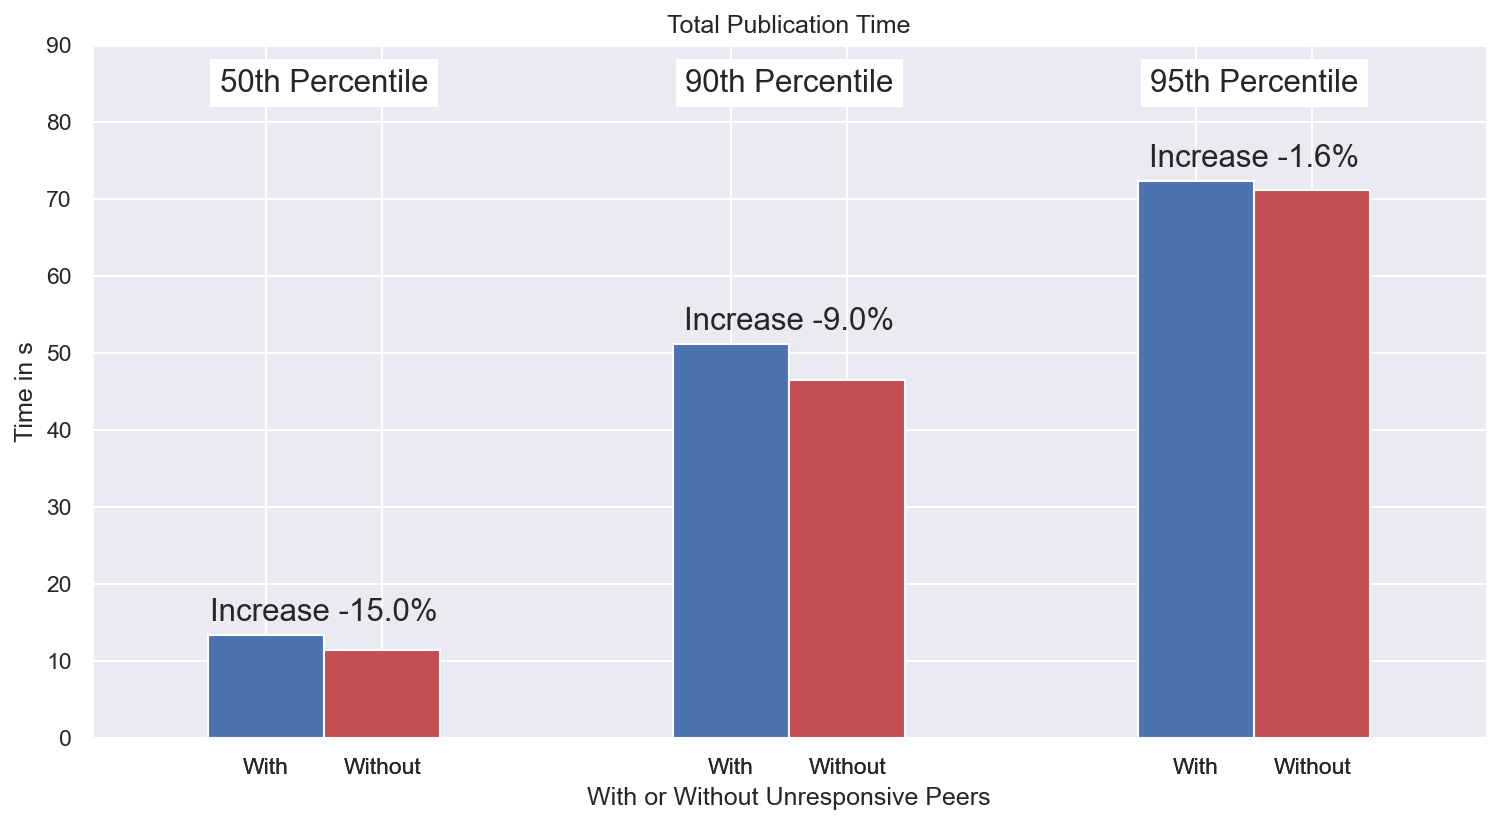
- The GET operation was also disrupted (in contrast to our initial assumption) and was slowed down by approximately 15%, at times reaching closer to 20%.
- The PUT operation was slowed down by approximately 10%
- The results we found were as follows:
We also experimented with even higher concurrency factors, in particular with
alpha = 20, as a potential mitigation strategy. We repeated the same experiment with one extra set of runs: the case where we interact with all nodes in the network (i.e., we do not ignore unresponsive peers), but have higher concurrency factor.
We found that the performance increased and went back to pre-incident levels. However, it was decided not to go down this path, as the increased concurrency factor would: i) increase significantly the overhead/traffic in the DHT network, and, ii) stick with nodes that do not upgrade later on (when the incident is resolved) giving a clear advantage advantage to those nodes.
# 🚑 Mitigation: how we stopped the bleeding.
The team’s immediate focus became:
- Adding/updating documentation on Kubo’s resource manager integration (opens new window)
- Triaging and responding to user questions/issues (example (opens new window))
- Preparing a new kubo release (
v0.18.1), where the default settings for the resource manager were set to more appropriate values. This reduced the likelihood that someone would need to adjust the resource manager configuration manually, thus avoiding the configuration “footguns”. - Encouraging as many nodes as possible to upgrade through public forums and direct relationships with known larger scale operators.
In parallel, we kept monitoring the situation by instrumenting a PUT and GET measurement experiment that was running since before the kubo-v0.18.1 update, when the affected nodes started updating gradually.
kubo-v0.18.1 was released on the 2023-01-30 (opens new window) and within the first 10 days, more than 8.5k nodes updated to this release. Our monitoring software allowed us to have an accurate view of the state of the network and observed that the update to the new kubo release brought significant performance increase for the GET operation - more than 40% at the 95th percentile on a sample of ~2k requests, compared to the situation before the kubo-v0.18.1 release.
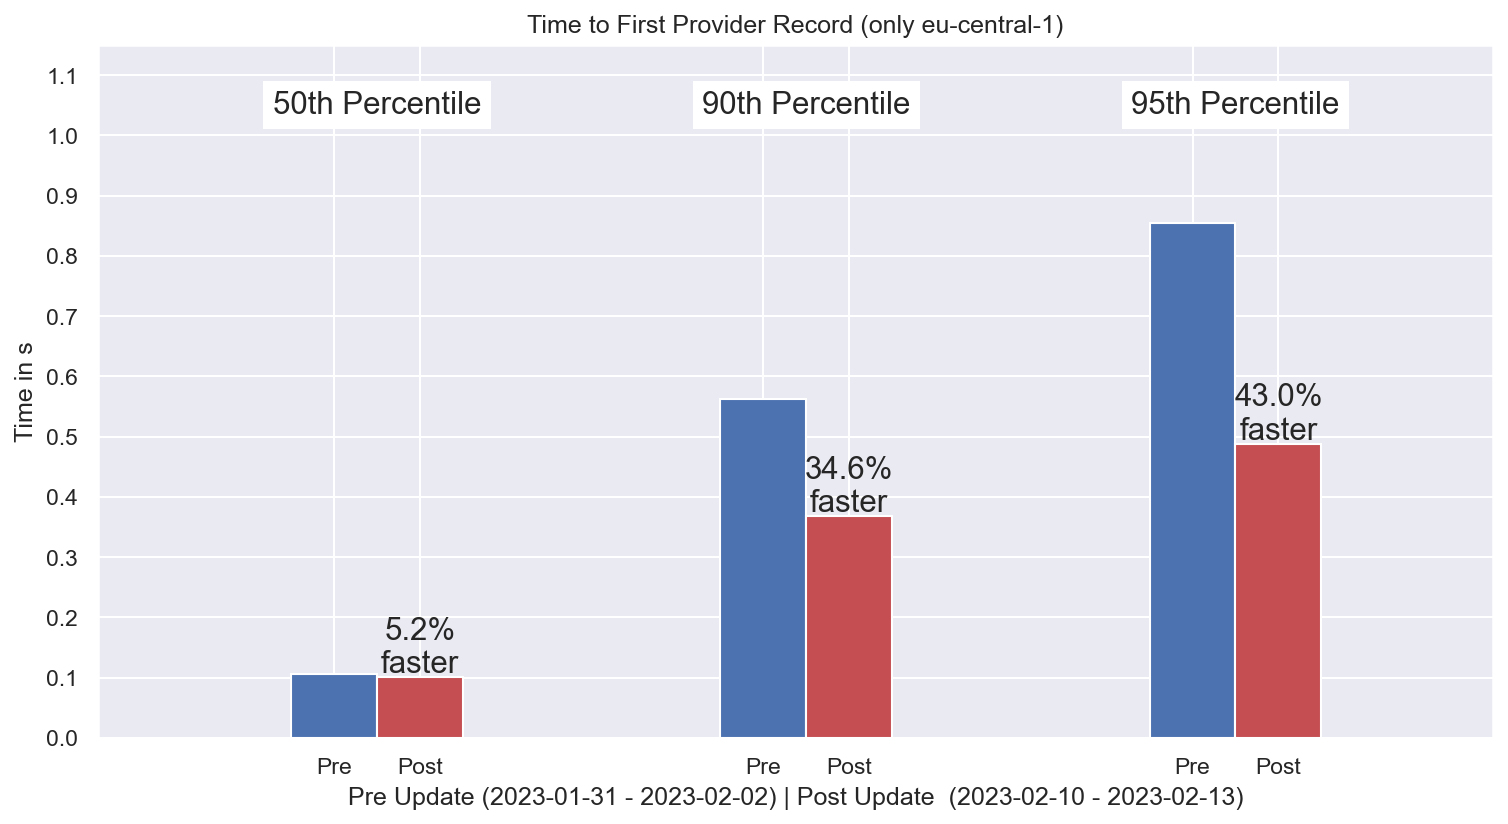
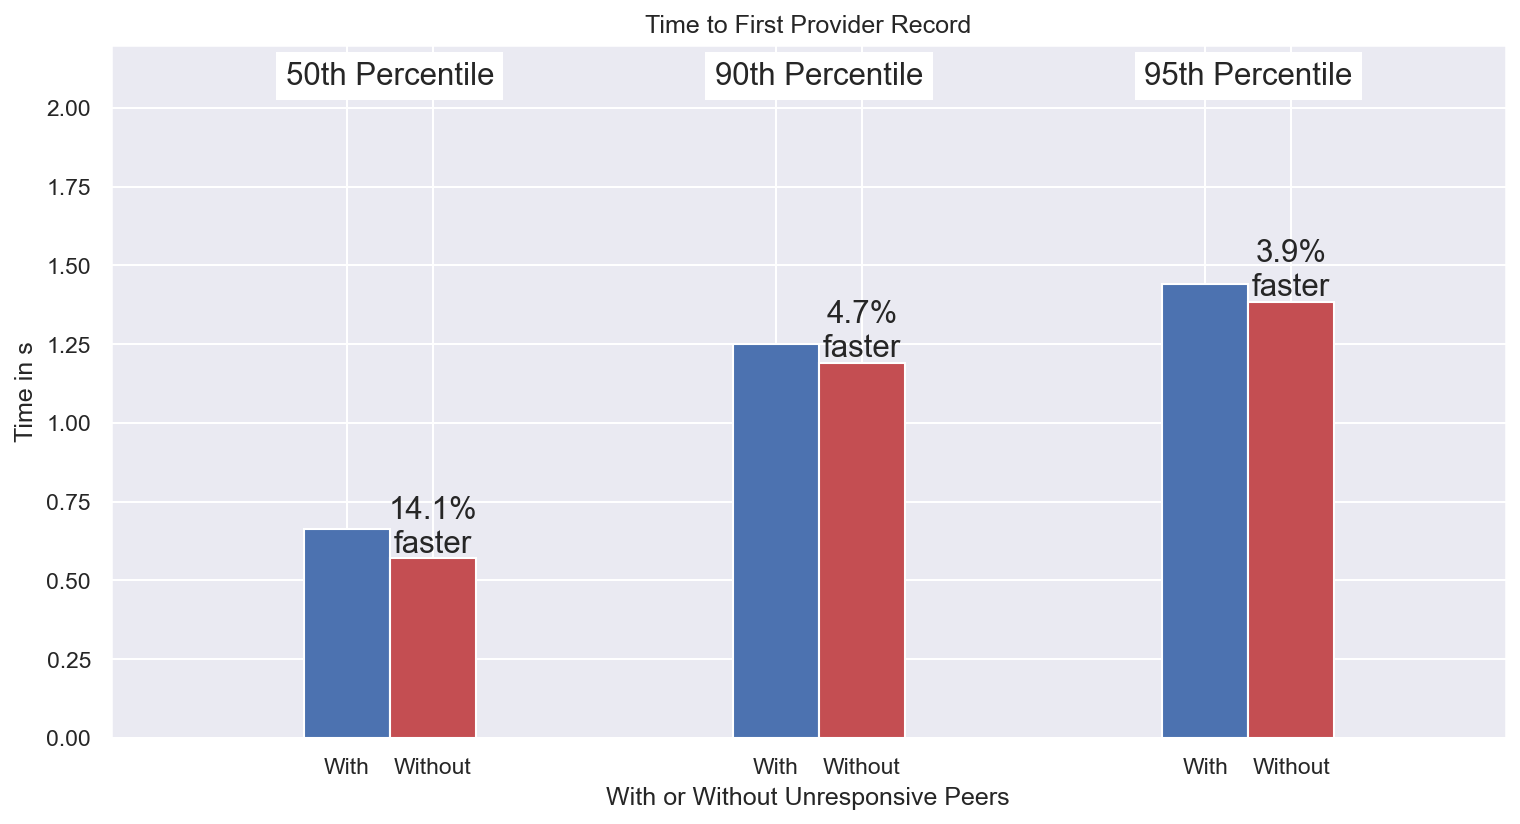
We also monitored the situation compared to the pre-incident performance by running the experiment where we ignored the set of PeerIDs that were identified as affected by the misconfiguration. As a sample from more than 20k GET operations, in the figure below we show that the impact has reduced to ~5% (mid-February 2023).
# 🔧 Addressing the Root Cause
Our immediate actions managed to stop the bleeding and bring the network back to normal quickly. However, it was clear that we had to implement longer term fixes to protect the nodes’ routing tables from unresponsive peers and to avoid inadvertently making nodes unresponsive. Specifically this translated to:
- Revamping the Kubo resource manager UX to further reduce the likelihood of catastrophic misconfiguration. This was completed in Kubo 0.19 (opens new window).
- Only adding peers to the routing table that are responsive requests during the routing table refresh (opens new window) (done) and upon adding a node to the routing table (opens new window) (in progress - targeting Kubo 0.21 in May (opens new window)).
# 📖 Lessons Learned
In the days since, we have come away from this experience with several important learnings:
🗒️ Significant fundamental changes to the codebase (such as retroactively adding resource accounting) is ripe for disruption. This increases the necessity for documentation, announcements, and clear recommendations to node operators.
⏱️ Monitoring software should always be in place to help identify such events from the start.
📣 It is challenging to monitor and apply changes directly to the software that runs on nodes of a decentralized network. Well-established communication channels go a long way and help the engineering teams communicate directly with the community. In IPFS, we use a variety of channels including the Discord Server [invite link (opens new window)], Filecoin Slack [invite link (opens new window)] (mostly in #engres-ip-stewards channel), the Discourse discussion forum (opens new window), and the blog (opens new window).
🚀 Last, but certainly not least, the decentralized, P2P nature of IPFS kept the network running with all important operations completing successfully (albeit slower than normal). It is exactly because of the structure of the network that there are no single points of failure and performance is not catastrophically disrupted even when more than half of the network nodes are essentially unresponsive.